由于图示在细节和宏观上的表达更直观,因此程序员不管是在开发之前做分析论证,开发过程中整理思路或者开发后的总结汇报,常常都需要以这种形式来呈现。作为图示中比重最大的关系图,不论是简单如Word, Pages的自带工具还是诸如Visio, OmniGraffle这些专业软件,都存在着操作和排版布局的问题;我经常在使用这些软件的过程中跑偏去调整布局而影响了整体思路的连贯性,大大降低了工作效率。这里面的矛盾在于程序员更倾向用干扰更少的文本而不是所见即所得的图形化工具来表达自己的思想,今天我要介绍的Graphviz 就是AT&T Labs Research开发的关系图脚本绘制工具
序言
让我们以Graphviz使用的一般流程作为例子开始吧:
digraph graphviz{
}
将以上文本保存为sample.dot文件(以UTF-8格式储存),如果已经安装配置好了Graphviz,在该文件所在目录下运行命令:
dot sample.dot -Tpng -o sample.png
即可在该目录下生成一个PNG文件,虽然这个PNG文件一片空白,什么内容都没有,但这就是Graphviz使用的一般流程,定义一个DOT文件,然后用命令输出你想要的可视文件,是不是非常简单? Graphviz本质是一个布局引擎,里面有多种布局方式可供选择,DOT是一种描述语言;这类似于浏览器和HTML的关系。
准备
首先进入Graphviz下载页面,找到自己平台的软件下载安装即可,macOS可以通过brew进行安装
brew install graphviz
* Windows平台安装后,需要手动将安装路径配置到$PATH中
Graphviz的布局引擎现阶段支持以下方式:
- dot 这是有向图的默认布局方式,采用水平或垂直的方式进行布局
- twopi 扇形布局,采用Radial Layout算法,首先确定一个Node为中心点,然后考虑其他节点和这个节点之间的距离作为半径,最终节点分散在不同半径的圆弧上
- circo 圆形布局,采用Circular Layout算法,和twopi类似,但是其忽略距离因素,将节点均匀分布在同一个圆上
- nearto 一种很紧凑的布局,大型图形(超过100个节点)的默认布局方式,采用Spring Algorithms算法,本质就是用胡克定律和库仑定律,通过节点之间的排斥和吸引力多次迭代后形成的图形
- fdp & sfdp 和上述的nearto类似,但nearto追求的是整体的迭代平衡,但fdp追求的是组和组的平衡; sfdp是fdp的并行版本
Graphviz可以输出多种格式,我经常使用:
- png 百度百科 - PNG
- svg 百度百科 - SVG
Graphviz的命令执行方式有两种,详情可参考Graphviz Command-line Invocation:
-
布局名 DOT输入文件 -T{输出格式} -o 输出文件,如:
circo 1.dot -Tsvg -o 1.svg -
dot DOT输入文件 -K{布局名} -T{输出格式} -o 输出文件,如:
dot 1.dot -Kcirco -Tsvg -o 1.svg
本章的最后,我们基于 Visual Studio Code 来打造一个简单的DOT语言编辑环境
由于Visual Studio Code | Marketplace关于Graphviz只有一个DOT语言的语法高亮插件vscode-graphviz存在;为了提高效率,我们至少需要一个预览功能,让我们基于Integrate with External Tools via Tasks来打造一个吧,如果后面反馈较好,并且我有时间,我可以做一个DOT的统一解决方案插件(颜色高亮,语法提示,预览,输出):
-
首先做一个Python脚本(生成PNG文件并且通过Visual Studio Code打开),并将文件存为 .vscode/make.py 文件:
#!/usr/bin/env python import subprocess import sys import os filepath, filename = os.path.split(sys.argv[2]) shotname, extension = os.path.splitext(filename) if extension == '.dot': outpath = filepath + '/' + shotname + '_' + sys.argv[1] + '.png' subprocess.call(['dot', sys.argv[2], '-K' + sys.argv[1], '-Tpng', '-o', outpath]) subprocess.call(['open', '-a', '/Applications/Microsoft Code.app', outpath]) else: print('Error input file: ' + sys.argv[2]) -
通过 Tasks:Configure Task Runner 命令生成一个任务配置文件 .vscode/tasks.json,并将文件内容替换为:
{ "version": "0.1.0", "command": "python", "isShellCommand": true, "args": [], "showOutput": "never", "echoCommand": false, "suppressTaskName": true, "tasks": [ { // 默认布局,主要用于有向图 "taskName": "dot", "args": ["${workspaceRoot}/.vscode/make.py", "dot", "${file}"] }, { // 基于spring-model(又称force-based)算法 "taskName": "neato", "args": ["${workspaceRoot}/.vscode/make.py", "neato", "${file}"] }, { // 径向布局 "taskName": "twopi", "args": ["${workspaceRoot}/.vscode/make.py", "twopi", "${file}"] }, { // 圆环布局 "taskName": "circo", "args": ["${workspaceRoot}/.vscode/make.py", "circo", "${file}"] }, { // 用于无向图 "taskName": "fdp", "args": ["${workspaceRoot}/.vscode/make.py", "fdp", "${file}"] } ] } -
之后对任何.dot文件,Command(Ctrl) + P,执行task {布局},如:task dot命令,即可在同目录下生成一个PNG文件,并通过Visual Studio Code打开一个标签栏进行预览
DOT脚本语言
首先我们来看看DOT脚本语言的基本特点
- DOT三要素:图(digraph, graph),节点(node),边(edge)
- 注释风格采用C/C++的方式,即 // 和 /* */,也支持#进行说明
- 语句风格类似于Python方式,即一行多语句用 ; 分割,单语句末尾不需要加 ; (加上也没问题),但我测试结果表明,其实用其他分隔符,比如说空格也没问题
- 多属性使用 , 进行分割,多属性值设定时,必须使用引号包起来,如:style=”striped, dashed”
- 内置的颜色,样式,形状等属性值可以不用双引号包起来(也可以包),字符串,#ff0000格式的颜色必须使用双引号包起来
图
- 使用graph定义无向图,使用digraph定义有向图,格式为:digraph/graph id {…}
- 图的属性设置方式有两种,其一是直接在{}内列出,如:size=”4,4”;另一种方式使用:graph [属性列表](不论graph,digraph还是下面将介绍的子图subgraph都使用这个关键字来定义图的属性)
我们延续上面的例子给他加上一个说明和一些属性对位置、呈现做一些限制,参考上面第二点,下面3段脚本最终呈现的结果都是一样的,因个人觉得属性和内容分开的方式表达更直观,所以我一般使用最后一种作为图和子图的默认用法,下同:
digraph graphviz{
    bgcolor = "#666666"     // 背景

    fontname="Futura"       // 字体
    fontcolor = white       // 字体颜色
    fontsize = 24           // 字体大小

    labelloc = t            // 标签垂直顶部
    labeljust = c           // 标签水平居中

    label = "Graphviz\n关系图脚本绘制工具"
}
digraph graphviz{
    graph [bgcolor = "#666666",
    fontname="Futura", fontcolor = white, fontsize = 24,
    labelloc = t, labeljust = c,
    label = "Graphviz\n关系图脚本绘制工具"]
}
digraph graphviz{
    graph [bgcolor = "#666666",
    fontname="Futura", fontcolor = white, fontsize = 24,
    labelloc = t, labeljust = c]

    label = "Graphviz\n关系图脚本绘制工具"
}

节点
- 使用node来定义节点,格式为:id [属性列表]
- 节点支持不定义直接使用,无label属性的节点使用其id作为label,支持中文名
- 可以使用:node [属性列表] 来定义默认属性,文档采用自上而下的方式解析,也就是说你可以多次覆盖默认属性,有效范围到下一次定义为止
- 节点id是全局有效的,因此你必须保证节点id的唯一性,多次定义永远只有一个有效
边
- 无向图graph的边使用:–,有向图digraph的边使用:->,这是严格要求的,用错不能正常解析
- 边的后面可以跟[]来定义边的属性
- 可以使用:edge [属性列表] 来定义默认属性,和节点的默认属性一样,你可以多次覆盖
- 边连接到节点的连接点,遵守:上北下南,左西右东的原则,分别使用方位n(North), s(South), w(West), e(East)来定义,一共有8个连接点:{n, ne, e, se, s, sw, w, nw},采用 {Node id}:方位 的形式
上面的例子中一个节点都没有,不可能构成任何的关系,让我们结合上面的知识点,改写如下:
digraph graphviz{
    // 定义图属性
    graph [bgcolor = "#666666",
    fontname="Futura", fontcolor = white, fontsize = 24,
    labelloc = t, labeljust = c]
    // 定义共用节点属性
    node [shape="cds", color="#dddddd", penwidth="0.5",style="filled",
    fixedsize=true, width=3, height=0.5, fontname="Futura", fontsize=10]
    // 定义公用边属性
    edge [color="#cccccc", style="dashed", arrowhead=vee, arrowsize=0.75, penwidth="0.75"]

    label = "Graphviz\n关系图脚本绘制工具"

    prepare [fillcolor="#dfc1c1", label="准备"]
    dot [fillcolor="#c1dfc1", label="DOT语言"]
    tpi [fillcolor="#c1c1df", label="第三方集成"]

    // 步骤
    prepare -> dot
    dot -> tpi
}

子图
- 子图使用subgraph定义,必须以cluster作为前缀,格式为: subgraph clusterXXX {…}
- 无向图的子图必须是无向图,有向图的子图必须是有向图,严格遵守边的要求
- 子图继承父图的属性,但可以对其进行重定义覆盖,范围仅限于该子图,不会对父图或兄弟图进行污染
- 子图可以无限嵌套,即子图内可以再定义子图
- Graphviz中,关系只存在节点之间,不存在节点与子图,子图和子图的关系;要解决这个问题,可以将上层的compound设置为true,然后通过将边属性中的lhead和ltail设定为相应的子图来建立
我们继续将上面每一步的子图补充完整:
digraph graphviz{
    // 定义图属性
    graph [bgcolor="#666666", style="rounded", color="#1c1c1c", penwidth="0.5",
    fontname="Futura", fontcolor=white, fontsize=24,
    labelloc=t, labeljust=c,
    compound=true]

    label = "Graphviz\n关系图脚本绘制工具"

    // 定义共用节点属性
    node [shape="cds", color="#1c1c1c", penwidth="0.5", style="filled",
    fixedsize=true, width=3, height=0.5, fontname="Futura", fontsize=10]
    // 定义公用边属性
    edge [color="#cccccc", style="dashed", arrowhead=vee, arrowsize=0.75, penwidth="0.75"]

    prepare [fillcolor="#dfc1c1", label="准备"]
    dot [fillcolor="#c1dfc1", label="DOT语言"]
    tpi [fillcolor="#c1c1df", label="第三方集成"]

    // 步骤
    prepare -> dot -> tpi

    node [shape="box", style="rounded,filled", color="#aaaaaa", width=2.75, height=0.4]
    edge [color="#222222", style="dotted"]

    subgraph cluster_prepare {
        graph [bgcolor="#dfc1c1", fontsize=12, labelloc=b]

        label = "准备"

        p_install [label="安装"]
        p_layout [label="布局引擎"]
        p_format [label="输出格式"]
        p_cmd [label="命令运行方式"]
        p_tools [label="工具"]

        p_install -> p_layout -> p_format -> p_cmd -> p_tools
    }
    subgraph cluster_dot {
        graph [bgcolor="#c1dfc1", fontsize=12, labelloc=b]

        label = "DOT语言"

        d_base [label="基本语法"]
        d_graph [label="图"]
        d_node [label="节点"]
        d_edge [label="边"]
        d_subgraph [label="子图"]
        d_group [label="分组与布局"]
        d_table [label="表格"]
        d_image [label="图片"]
        d_strict [label="约束条件"]

        d_base -> d_graph -> d_node -> d_edge -> d_subgraph -> d_group -> d_table -> d_image -> d_strict
    }
    subgraph cluster_tpi {
        graph [bgcolor="#c1c1df", fontsize=12, labelloc=b]
        edge [style="invis"]

        label = "第三方集成"

        t_c [label="C", color="#ff4444"]
        t_python [label="Python"]
        t_javascript [label="JavaScript"]
        t_other [label="..."]

        t_c -> t_python -> t_javascript -> t_other
    }

    edge [dir=none, color="#ffffff"]
    prepare -> p_install [lhead=cluster_prepare]
    dot -> d_base [lhead=cluster_dot]
    tpi -> t_c [lhead=cluster_tpi]
}

分组与布局
- Graphviz的布局模式有TB(从上倒下),BT(从下到上),LR(从左到右),RL(从右到左)四种模式,默认为TB,通过rankdir设置
- 布局模式也是一种图属性,也能被继承
- 分组通过{}来处理,组内如果不设定rank,其意义仅仅类似于脚本代码分块,通过rank设定后,组内的成员按照设定排列,常用的有same,表示组内成员在同一维度上,比如说默认从上到下的排列模式下,组内成员在同一水平位置
利用分组和布局将上面的例子调整一下,让排列更整齐一些:
digraph graphviz{
    // 定义图属性
    graph [bgcolor="#666666", style="rounded", color="#1c1c1c", penwidth="0.5",
    fontname="Futura", fontcolor=white, fontsize=24,
    labelloc=t, labeljust=c,
    compound=true]

    label = "Graphviz\n关系图脚本绘制工具"

    // 定义共用节点属性
    node [shape="cds", color="#1c1c1c", penwidth="0.5", style="filled",
    fixedsize=true, width=3, height=0.5, fontname="Futura", fontsize=10]
    // 定义公用边属性
    edge [color="#cccccc", style="dashed", arrowhead=vee, arrowsize=0.75, penwidth="0.75"]

    {
        rank = same
        prepare [fillcolor="#dfc1c1", label="准备"]
        dot [fillcolor="#c1dfc1", label="DOT语言"]
        tpi [fillcolor="#c1c1df", label="第三方集成"]

        // 步骤
        prepare -> dot -> tpi
    }

    node [shape="box", style="rounded,filled", color="#aaaaaa", width=2.75, height=0.4]
    edge [color="#222222", style="dotted"]

    subgraph cluster_prepare {
        graph [bgcolor="#dfc1c1", fontsize=12, labelloc=b]

        label = "准备"

        p_install [label="安装"]
        p_layout [label="布局引擎"]
        p_format [label="输出格式"]
        p_cmd [label="命令运行方式"]
        p_tools [label="工具"]

        p_install -> p_layout -> p_format -> p_cmd -> p_tools
    }
    subgraph cluster_dot {
        graph [bgcolor="#c1dfc1", fontsize=12, labelloc=b]

        label = "DOT语言"

        d_base [label="基本语法"]
        d_graph [label="图"]
        d_node [label="节点"]
        d_edge [label="边"]
        d_subgraph [label="子图"]
        d_group [label="分组与布局"]
        d_table [label="表格"]
        d_image [label="图片"]
        d_strict [label="约束条件"]

        d_base -> d_graph -> d_node -> d_edge -> d_subgraph -> d_group -> d_table -> d_image -> d_strict
    }
    subgraph cluster_tpi {
        graph [bgcolor="#c1c1df", fontsize=12, labelloc=b]
        edge [style="invis"]

        label = "第三方集成"

        t_c [label="C", color="#ff4444"]
        t_python [label="Python"]
        t_javascript [label="JavaScript"]
        t_other [label="..."]

        t_c -> t_python -> t_javascript -> t_other
    }

    edge [dir=none, color="#ffffff"]
    prepare -> p_install [lhead=cluster_prepare]
    dot -> d_base [lhead=cluster_dot]
    tpi -> t_c [lhead=cluster_tpi]
}

表格
- Graphviz的表格也是一种节点类型,使用label标签来指定内容和格式
- 内置布局方式通过shape为record(矩形框) & Mrecord(圆角矩形框)来指定,如果和当前方向一致使用|来隔开,使用{|}表示和当前方向相反,比如说默认是纵向布局方式,那|隔开的也是从上到下,{|}则是从左到右,只是要注意,如果是在一个{|}内部再{|},又变成了从上到下(如果只是文字换行,可以在文字末尾加\n(居中对齐)\l(左对齐)\r(右对齐)进行切分)
- 内置布局最大的问题是不能分别调整每个格子里的颜色和字体,所以如果需要更丰富的控制可以通过使用HTML表格标签,这种方式不要求shape为record或Mrecord样式,另外需要注意的是使用<>而不是双引号来引用内容
图片
通过image属性可以给指定节点加上图片背景,通常情况下为了避免干扰需要将shape设为none并将label置空,当然你也可以通过HTML表格标签内部嵌套IMAGE来使用
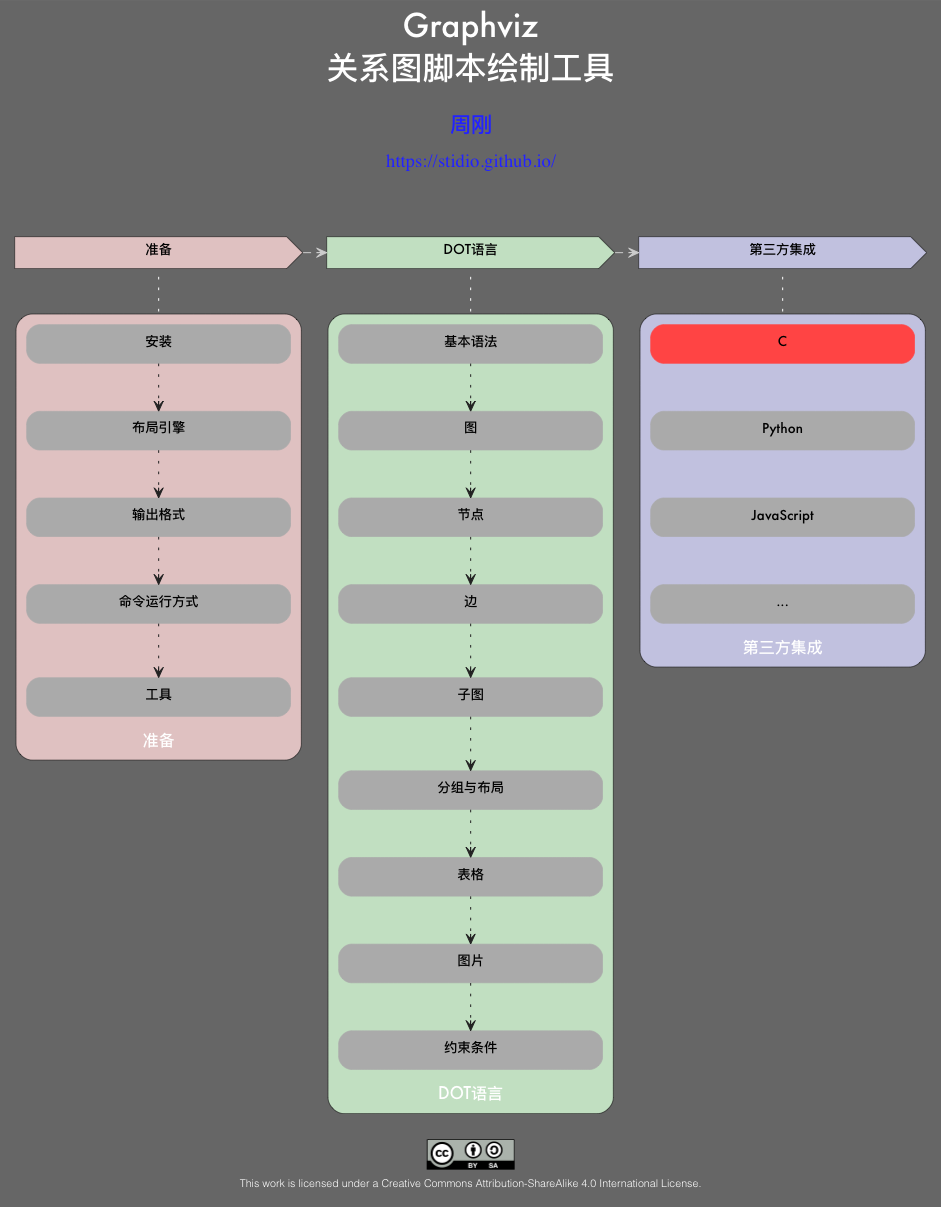
下面我们就利用这两节知识点来加上版权信息和脚注,并形成最终定稿:
digraph graphviz{
    // 定义图属性
    graph [bgcolor="#666666", style="rounded", color="#1c1c1c", penwidth="0.5",
    fontname="Futura", fontcolor=white, fontsize=24,
    labelloc=t, labeljust=c,
    compound=true]

    label = "Graphviz\n关系图脚本绘制工具"

    copyright [shape=plaintext, fontcolor="#2222ff", label=<
                <TABLE BORDER="0">
                <TR><TD><FONT FACE="Futura" POINT-SIZE="16">周刚</FONT></TD></TR>
                <TR><TD>https://stidio.github.io/</TD></TR>
                </TABLE>
                >]

    // 定义共用节点属性
    node [shape="cds", color="#1c1c1c", penwidth="0.5", style="filled",
    fixedsize=true, width=3, height=0.5, fontname="Futura", fontsize=10]
    // 定义公用边属性
    edge [color="#cccccc", style="dashed", arrowhead=vee, arrowsize=0.75, penwidth="0.75"]

    {
        rank = same
        prepare [fillcolor="#dfc1c1", label="准备"]
        dot [fillcolor="#c1dfc1", label="DOT语言"]
        tpi [fillcolor="#c1c1df", label="第三方集成"]

        // 步骤
        prepare -> dot -> tpi
    }

    copyright -> dot [style=invis]

    node [shape="box", style="rounded,filled", color="#aaaaaa", width=2.75, height=0.4]
    edge [color="#222222", style="dotted"]

    subgraph cluster_prepare {
        graph [bgcolor="#dfc1c1", fontsize=12, labelloc=b]

        label = "准备"

        p_install [label="安装"]
        p_layout [label="布局引擎"]
        p_format [label="输出格式"]
        p_cmd [label="命令运行方式"]
        p_tools [label="工具"]

        p_install -> p_layout -> p_format -> p_cmd -> p_tools
    }
    subgraph cluster_dot {
        graph [bgcolor="#c1dfc1", fontsize=12, labelloc=b]

        label = "DOT语言"

        d_base [label="基本语法"]
        d_graph [label="图"]
        d_node [label="节点"]
        d_edge [label="边"]
        d_subgraph [label="子图"]
        d_group [label="分组与布局"]
        d_table [label="表格"]
        d_image [label="图片"]
        d_strict [label="约束条件"]

        d_base -> d_graph -> d_node -> d_edge -> d_subgraph -> d_group -> d_table -> d_image -> d_strict
    }
    subgraph cluster_tpi {
        graph [bgcolor="#c1c1df", fontsize=12, labelloc=b]
        edge [style="invis"]

        label = "第三方集成"

        t_c [label="C", color="#ff4444"]
        t_python [label="Python"]
        t_javascript [label="JavaScript"]
        t_other [label="..."]

        t_c -> t_python -> t_javascript -> t_other
    }

    edge [dir=none, color="#ffffff"]
    prepare -> p_install [lhead=cluster_prepare]
    dot -> d_base [lhead=cluster_dot]
    tpi -> t_c [lhead=cluster_tpi]

    footer [fixedsize=true, width=8, height=0.8,
    shape=plaintext, style="",
    fontcolor=white, fontsize=8,
    label=<
        <TABLE BORDER="0">
            <TR><TD><IMG SRC="CC-BY-SA_icon.png"/></TD></TR>
            <TR><TD>This work is licensed under a Creative Commons Attribution-ShareAlike 4.0 International License.</TD></TR>
        </TABLE>
        >]

    d_strict -> footer [style=invis]
}
约束条件
默认情况下两个节点之间你可以建立多个相同的关系,也就是有多条边相连,如果在graph或digraph前加上 strict 关键字,输出结果只会保留最后一条边
第三方集成
Graphviz这套系统不仅仅限于使用人力来绘制,其提供了标准的C接口,并在这之上针对Java, Perl, PHP, Python, Ruby等语言做了封装;此外也有一些好用的第三方封装,比如Python的pygraphviz, pydot,在这些接口的帮助下,我们可以很轻松的进行第三方集成,比如绘制人物关系图谱,做函数调用分析等;
常用属性 (具体参考)
| [共用] 属性名称 | 默认值 | 含义 |
|---|---|---|
| color | black | 颜色, 通常指定线条颜色, 具体参考 |
| penwidth | 1.0 | 线条宽度 |
| style | 样式,常指线条样式,具体参考 | |
| fontcolor | black | 字体颜色 |
| fontname | Times-Roman | 字体 |
| fontsize | 14 | 字体大小 |
| label | id | 标签 |
| [图] 属性名称 | 默认值 | 含义 |
|---|---|---|
| bgcolor | 背景颜色 | |
| size | 大小(inch) | |
| radio | height/width | |
| nodesep | 0.25 | 节点之间的间隔 |
| labelloc | 标签垂直位置, 取值有t(上),b(下), |
|
| labeljust | 标签水平位置, 取值有l(左),r(右),c(中) | |
| compound | false | 组合模式 |
| rankdir | TB(从上到下) | dot模式下排列方向, {TB,BT,LR,RL}四个属性可选 |
| [节点] 属性名称 | 默认值 | 含义 |
|---|---|---|
| shape | ellipse | 形状, 具体参考 当shape=polygon时,我们经常会用到以下4个值: sides 边数(>2) regular 是否是一个规则的多边形(默认为:false) skew 倾斜角度, 通过该值可将一个矩形转为平行四边形, 默认为:0.0 distortion 梯度值, 通过该值可将一个矩形转为梯形, 默认为:0.0 |
| peripheries | 1 | 外框层数, 比如状态机的结束状态可将该值设为2得到一个两层的圆环 |
| orientation | 0.0 | 旋转角度 |
| fillcolor | lightgrey | 填充颜色, 非填充相关模式该值无效, 填充模式下如果未设定该值, 将使用color来填充 |
| width | 宽度, dot模式或fixedsize=true该值即为最终节点宽度值, 否则该值无效 | |
| height | 高度, 同上 | |
| fixedsize | false | 固定大小, 具体参考 |
| [边] 属性名称 | 默认值 | 含义 |
|---|---|---|
| dir | forward | 箭头方向 {forward, back, both, none} 四个值可选 |
| arrowhead | normal | 箭头头部形状, 具体参考 |
| arrowtail | normal | 箭头尾部形状, 同上 |
| arrowsize | 1.0 | 箭头大小 |
| constraint | true | 是否影响整体排列, 具体参考 |
| decorate | false | 如果设置为true,在边的label下会有一条下划线与边相连 |
| headlabel | 边的头标签 | |
| taillabel | 边的尾标签 | |
| lhead | 图属性中compound为true时, 通过该值设定被指向的子图 | |
| ltail | 同上 |
One more thing
没有做不到只有想不到,其实Graphviz还可以做更多的事,下面是我在网络上看到的几个有意思的例子:
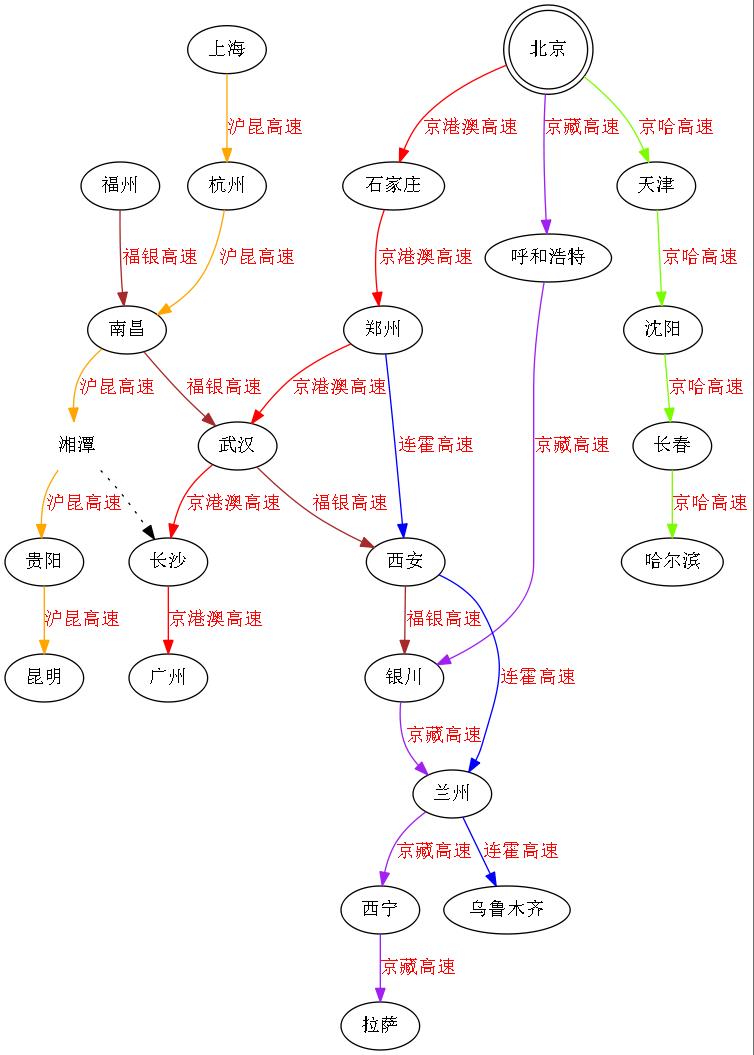
高速公路路线图
digraph {
    edge[fontname="SimSun",fontcolor=red];
    node[fontname="SimSun",size="20,20"];

    北京[shape=doublecircle];
    湘潭[shape=plaintext]

    //高速公路节点关系
    北京->石家庄->郑州->武汉->长沙->广州[label=京港澳高速,color=red];
    北京->天津->沈阳->长春->哈尔滨[label=京哈高速,color=lawngreen];
    北京->呼和浩特->银川->兰州->西宁->拉萨[label=京藏高速,color=purple];
    郑州->西安->兰州->乌鲁木齐[label=连霍高速,color=blue]
    上海->杭州->南昌->湘潭->贵阳->昆明[label=沪昆高速,color=orange];
    福州->南昌->武汉->西安->银川[label=福银高速,color=brown];
    湘潭->长沙[style=dotted];
}
UML
digraph G{

  fontname = "Courier New"
  fontsize = 10

  node [ fontname = "Courier New", fontsize = 10, shape = "record" ];
  edge [ fontname = "Courier New", fontsize = 10 ];

  Animal [ label = "{Animal |+ name : String\l+ age : int\l|+ die() : void\l}" ];

      subgraph clusterAnimalImpl{
          bgcolor="yellow"
          Dog [ label = "{Dog||+ bark() : void\l}" ];
          Cat [ label = "{Cat||+ meow() : void\l}" ];
      };

  edge [ arrowhead = "empty" ];

  Dog->Animal;
  Cat->Animal;
  Dog->Cat [arrowhead="none", label="0..*"];
}
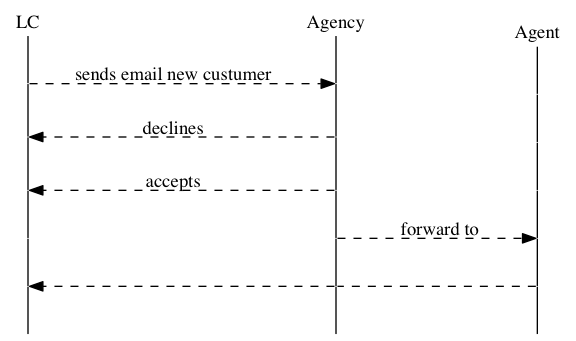
时序图
digraph G {
    rankdir="LR";
    node[shape="point", width=0, height=0];
    edge[arrowhead="none", style="dashed"]

    {
        rank="same";
        edge[style="solided"];
        LC[shape="plaintext"];
        LC -> step00 -> step01 -> step02 -> step03 -> step04 -> step05;
    }

    {
        rank="same";
        edge[style="solided"];
        Agency[shape="plaintext"];
        Agency -> step10 -> step11 -> step12 -> step13 -> step14 -> step15;
    }

    {
        rank="same";
        edge[style="solided"];
        Agent[shape="plaintext"];
        Agent -> step20 -> step21 -> step22 -> step23 -> step24 -> step25;
    }

    step00 -> step10 [label="sends email new custumer", arrowhead="normal"];
    step11 -> step01 [label="declines", arrowhead="normal"];
    step12 -> step02 [label="accepts", arrowhead="normal"];
    step13 -> step23 [label="forward to", arrowhead="normal"];
    step24 -> step14;
    step14 -> step04 [arrowhead="normal"];
}
上述例子所涉及的知识点在DOT语言章节都有覆盖,具体分析和使用就交与读者吧,如果有什么不明白的可以给我留言;这里我要着重说下软件工程中的[时序,流程,用例,状态,组件]图使用Graphviz来画虽然都能实现,但太繁琐了一些,关于这类图形下一篇文章我将基于PlantUML讲述如何简单优雅的进行描绘
参考资料
Graphviz Documentation
使用graphviz绘制流程图(2015版)
使用Graphviz绘制流程图和关系图
使用Graphviz下的dot工具绘制图像
Drawing Graphs using Dot and Graphviz
An Introduction to GraphViz and dot
用 Graphviz 可视化函数调用
原始链接 版权声明:自由转载-非商用-非衍生-保持署名 | Creative Commons BY-NC-ND 4.0